Oktober 2018 Archives
2018-10-15 16:31:39
SNI in RHEL 5 Apache
The custom httpd package for RHEL/CentOS 5 now also offers SNI / server name indication. And the default size of dhparams was increased to 2048 bit (RHEL 6 default: 1024 bit). In total these enhancements were done on the original package:
httpd-2.2.3-92.4.el5_11
- provide SNI support
- recompiled against openssl1 package (ported from RHEL 6)
- use bigger DH params
- some secure basic options for SSL_CTX_set_options() hardcoded
- basic ECDH support
- improved default SSLCipherSuite in ssl.conf
- configurable DH params by SSLDhParamsFile config option
- weekly cronjob for updating dh2048.pem
News history tuxad repository:
- 2018/07 tuxad RH5 repo now with PHP/openssl1
- 2016/10 More packages recompiled against OpenSSL 1
- 2016/05 RHEL 5 RPM packages with SSL enhancements
- 2016/03 Enhanced encryption for dovecot on RHEL/CentOS 5
- 2015/04 tuxad yum package repository for RHEL / CentOS 5 x86_64
- 2014/12 YUM repository for RHEL / CentOS 5
- 2014/11 OpenSSL updates/enhancements for RHEL / Centos 5
Posted by Frank W. Bergmann | Permanent link | File under: ssl, encryption, rpm, yum, repository, redhat, openssl, http, apache
2018-10-03 18:03:24
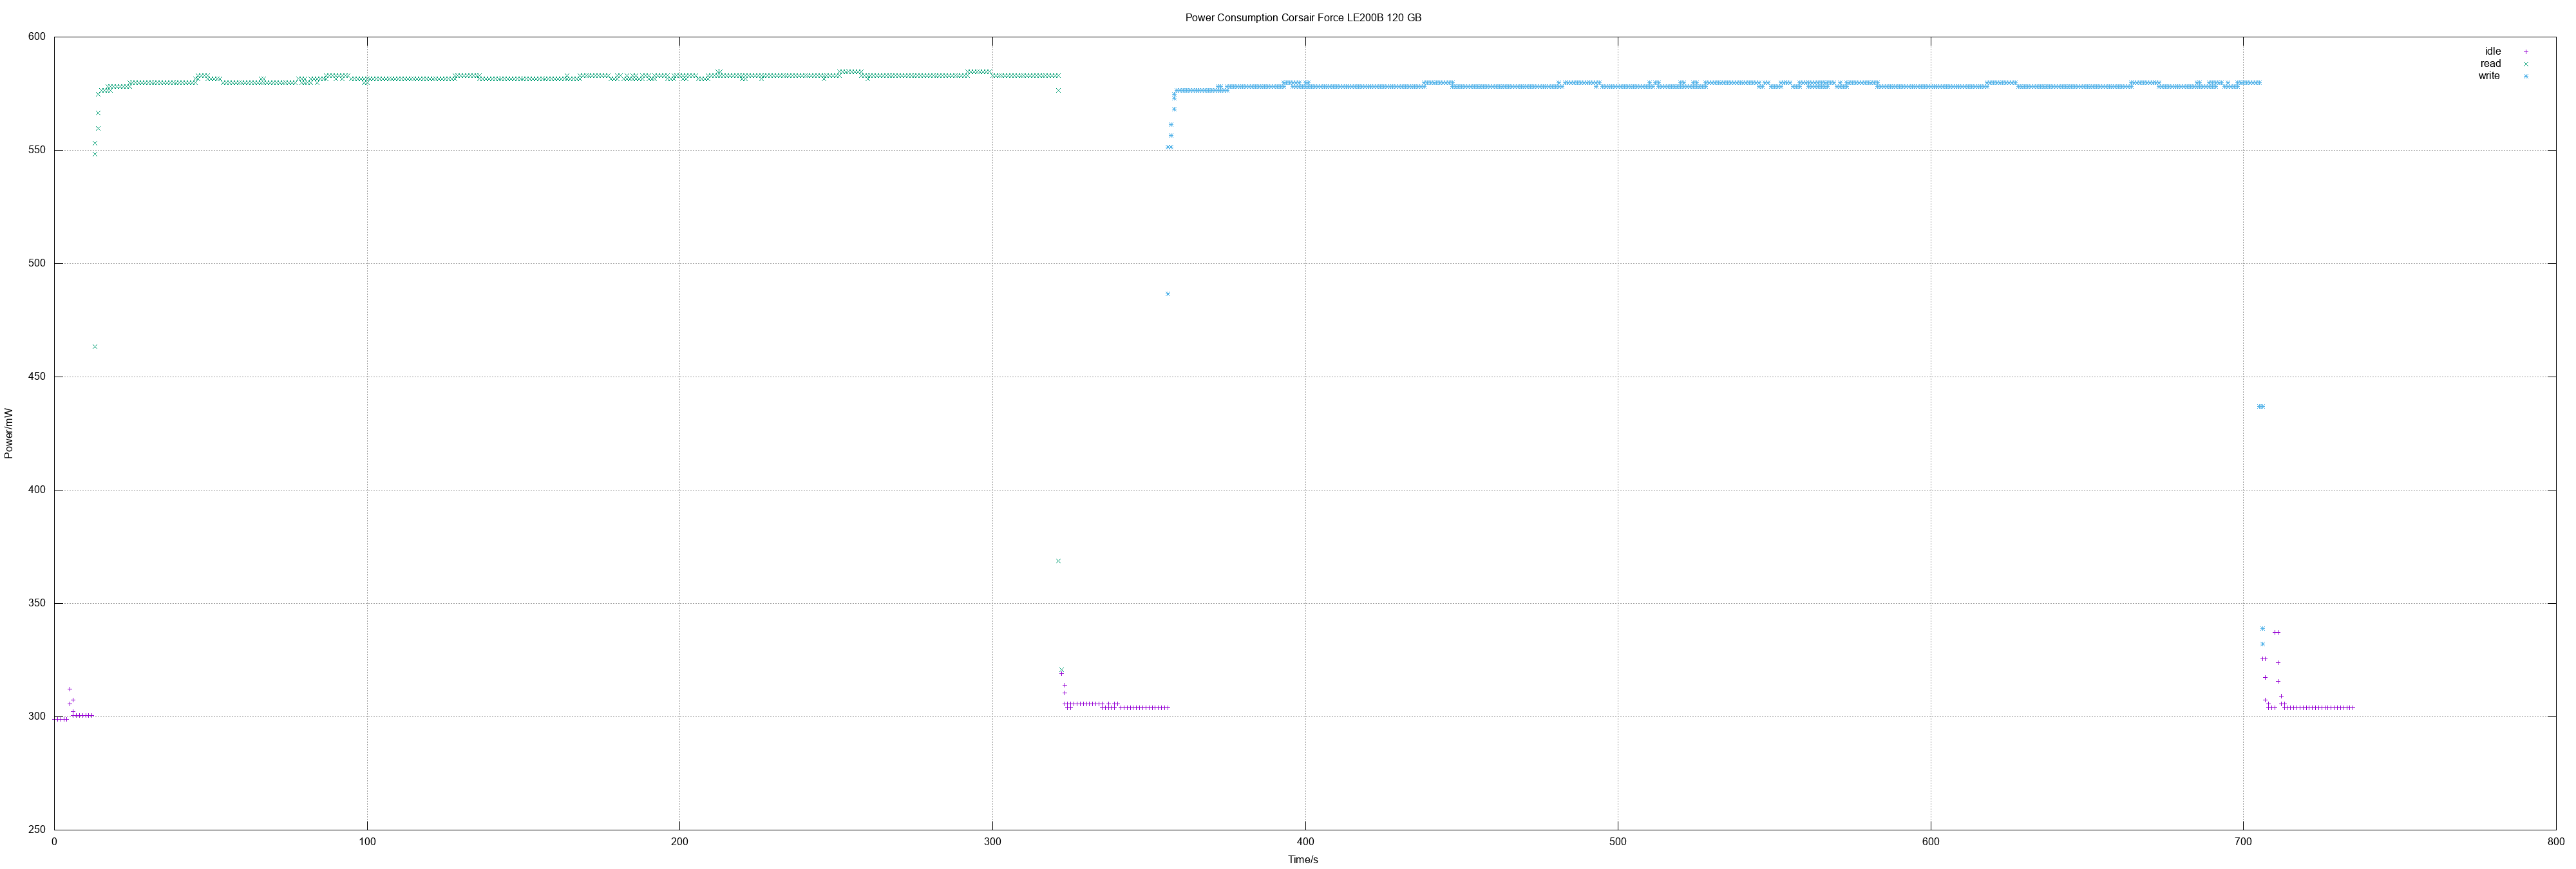
Power Measuring Corsair Force LE200B 120 GB (#2)
It's the second time that I measure an SSD of this model. These are my measuring values:
- Idle 0.31 W
- Read 0.59 W
- Write 0.58 W
Measuring environment is explained in power measuring ADATA SU800.
Other measurements:
2018-10-03 17:58:27
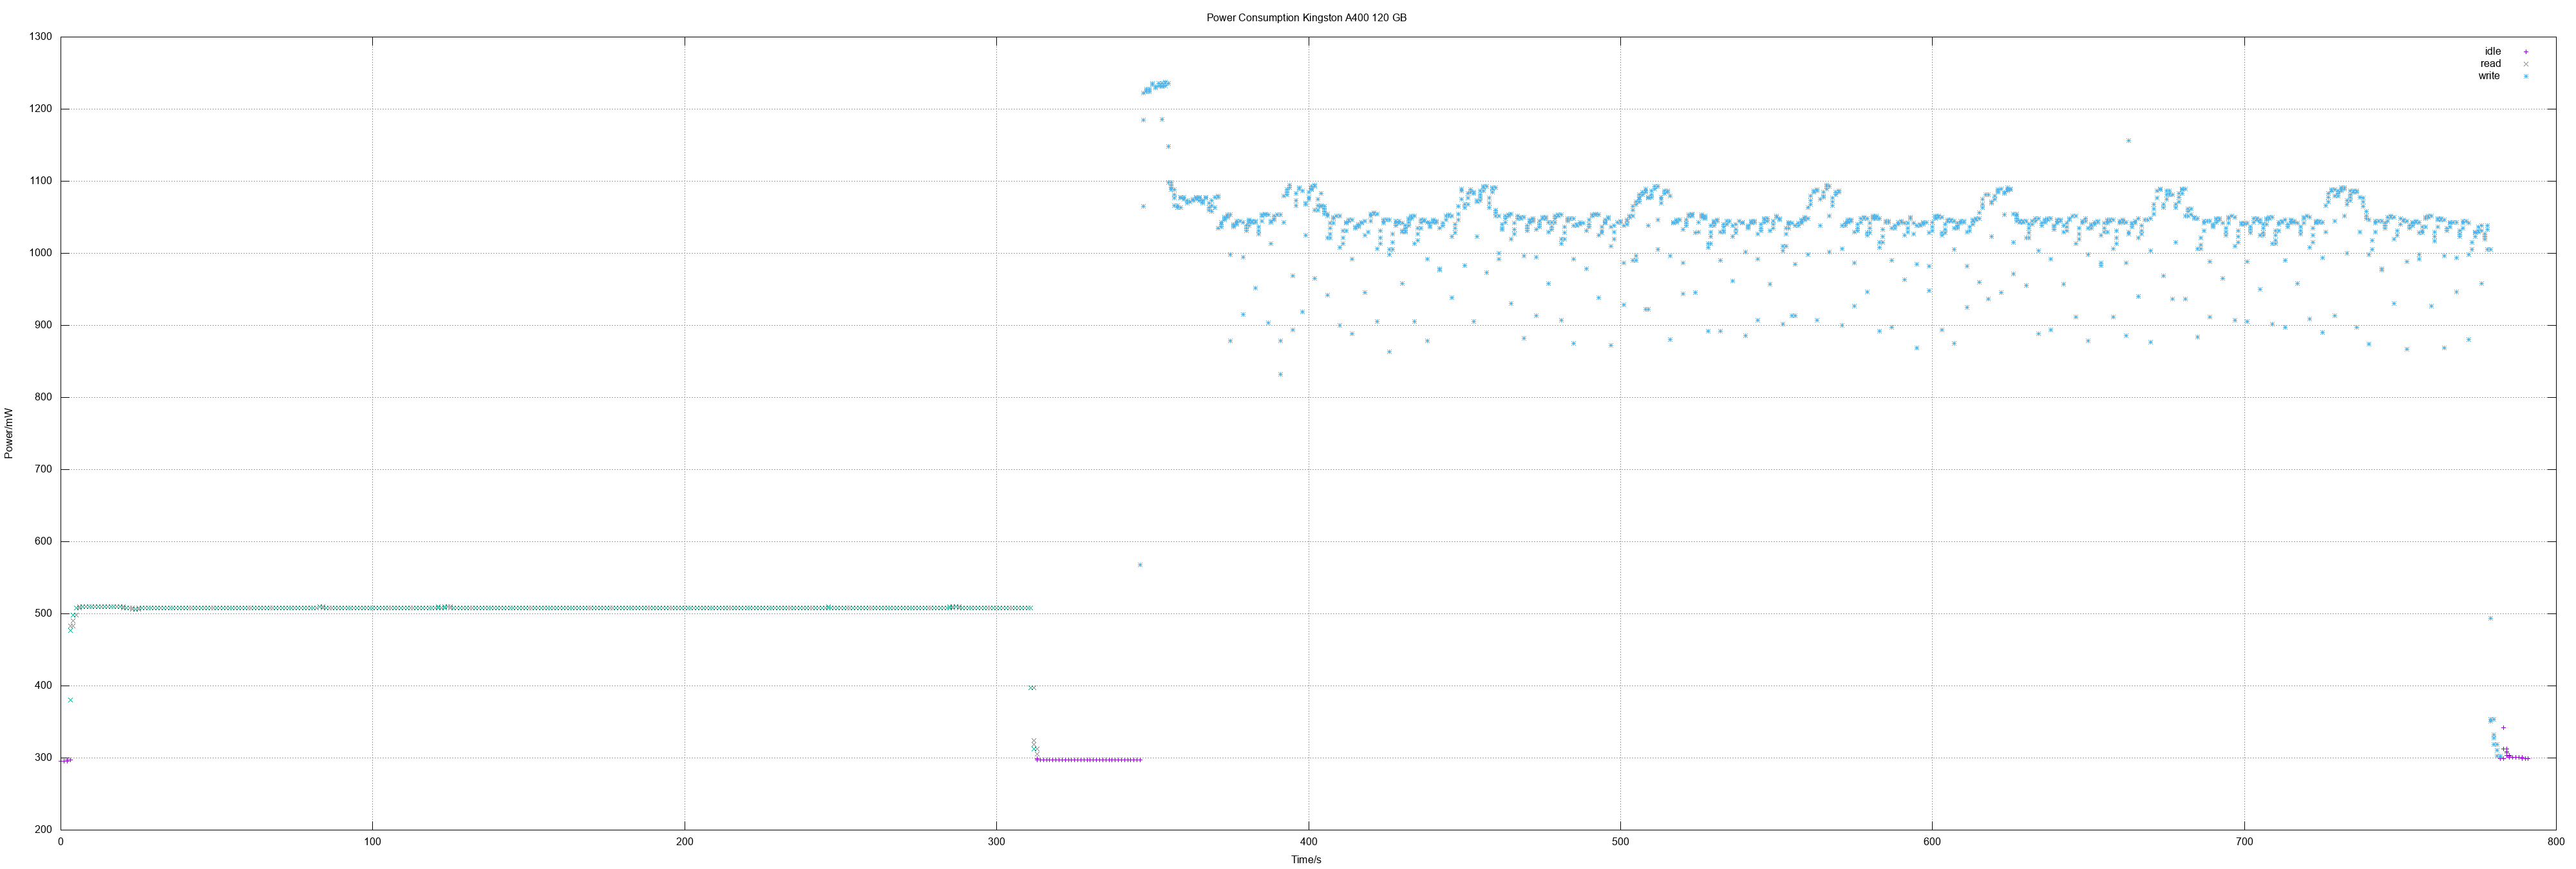
Power Measuring Kingston A400 120 GB
These are my measuring values:
- Idle 0.3 W
- Read 0.51 W
- Write 1.05 W
Measuring environment is explained in power measuring ADATA SU800.
Other measurements:
2018-10-01 00:20:33
threadcpu - show CPU usage of threads
threadcpu is a most simple Linux tool to measure CPU usage of threads in user% and system%. It tries to identify Java processes and if it detects a Java process it calls "jstack" for this process to get the NIDs/PIDs of its threads and also the names of the threads. This is the help page:
$ threadcpu -h

threadcpu shows CPU usage of threads in user% \
          and system%

usage:
threadcpu [-h] [-s seconds] [-p path-to-jstack]

options:
  -h display this help page
  -s measuring interval in seconds, default: 10
  -p path to JRE jstack, default: /usr/bin/jstack
example usage:
  threadcpu -s 30 -p /opt/java/bin/jstack \
            2>/dev/null|sort -n|tail -n 12
output columns:
  user percent <SPACE> system percent <SPACE> \
               PID/NID [ <SPACE> JVM thread \
               name OR (process name) ]
When a system has a higher load this tool can help you to detect the Java threads which are consuming most CPU times and thus maybe causing the load.
Here are some sample outputs:
$ threadcpu |sort -n|tail -n 8
3 0 33113 (klzagent)
3 0 38518 (klzagent)
3 0 9874 (BESClient)
3 41 6809 (threadcpu)
3 8 27353 VM Periodic Task Thread
6 0 31913 hybrisHTTP4
21 8 27347 C2 CompilerThread0
50 41 3244 (BESClient)

$ threadcpu |sort -n|tail -n 8
0 20 52358 (threadcpu)
0 40 32 (kswapd0)
2 50 2863 (BESClient)
11 0 31861 Gang worker#0 (Parallel CMS Threads)
11 0 31862 Gang worker#1 (Parallel CMS Threads)
11 0 31863 Gang worker#2 (Parallel CMS Threads)
11 0 31864 Gang worker#3 (Parallel CMS Threads)
47 10 31865 Concurrent Mark-Sweep GC Thread

$ threadcpu |sort -n|tail -n 8
2 0 14311 hybrisHTTP33
2 4 60077 ajp-bio-8009-exec-11609
2 8 30657 (klzagent)
4 0 5661 ajp-bio-8009-exec-11649
11 16 28144 (batchman)
15 20 3485 (BESClient)
21 0 7652 ajp-bio-8009-exec-11655
25 0 7611 ajp-bio-8009-exec-11654
You may also want to check the README or the man page. The download archive also contains a precompiled binary for Intel architecture: